
Capital City 5-Year House Price Growth: Which Australian City Won
If you've been watching Australia's property market over the past five years, one thing is crystal clear: not all capital cities are created equal. While the national conversation often centers on Sydney and Melbourne, the real wealth-building story has been unfolding in Perth, Brisbane, and Adelaide cities that have quietly delivered returns that would make even seasoned investors do a double take.
This in-depth guide breaks down the five-year house price growth across every Australian capital city, verifies each figure against Cotality's official Home Value Index data, and explains the economic forces driving each result. Whether you're a first home buyer weighing up where to plant roots, a property investor reviewing your next move, or simply trying to understand where Australia's residential property market is heading, this is the data you need.
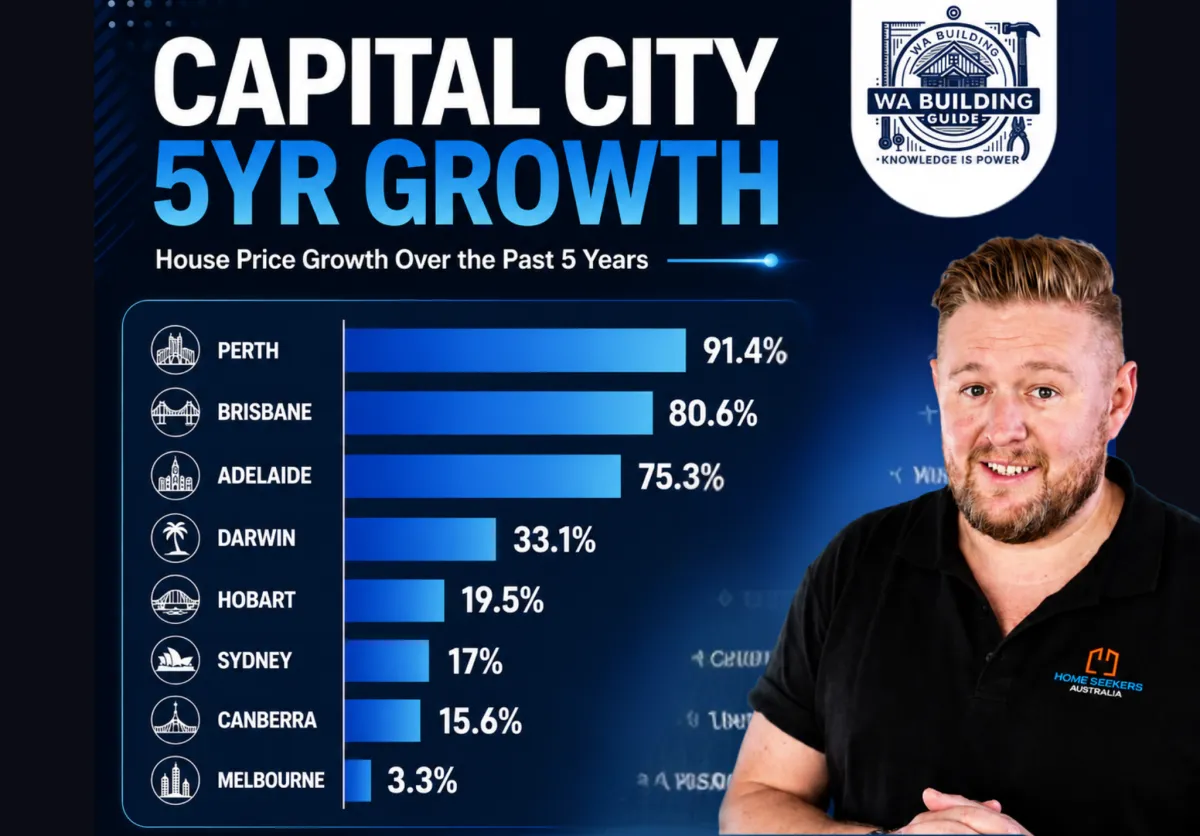
The Official Five-Year Growth Rankings at a Glance
Based on Cotality's verified dwelling value data, here is how each Australian capital city has performed over the past five years (trough-to-peak or rolling five-year period):
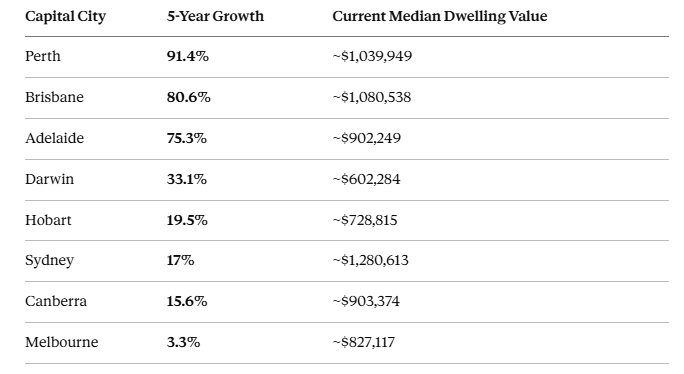
The divergence is stark. Perth has nearly doubled in value. Melbourne, once the undisputed growth engine of Australian property, has barely moved. Let's examine each city in turn.
Sources: Cotality Home Value Index; propertyupdate.com.au; yourmortgage.com.au data current as of mid-2026
Perth: Australia's Runaway Leader at 91.4% Growth
Perth is the undisputed standout of the past five years. According to Cotality's latest figures, Perth dwelling values have surged 91.4% over the five-year period the strongest result of any Australian capital city by a substantial margin. In dollar terms, that kind of growth has added hundreds of thousands of dollars to the typical homeowner's wealth.
What drove this extraordinary run?
Supply chronically undersupplying demand. Advertised stock in Perth has been tracking roughly 40% below its five-year average, creating an environment where buyers compete fiercely for very few available properties. This fundamental imbalance between supply and demand has been the engine of price growth.
The commodities cycle. Western Australia's economy is deeply tied to iron ore, gold, lithium, and other resources. Strong commodity prices translate into high-wage employment, which flows directly into housing demand across Perth's suburbs.
Interstate migration. Thousands of Australians have relocated to WA in search of more affordable entry points, lifestyle benefits, and strong employment prospects particularly in the resources and defense sectors.
Infrastructure investment. A decade-long pipeline of roads, renewables, defense infrastructure, and public transport projects has reinforced long-term confidence in Perth's economy.
As of mid-2026, Perth's median house value sits at approximately $1,087,507. Monthly growth continues to lead the nation, with Cotality recording a 1.5% rise in dwelling values in May 2026 alone adding roughly $15,100 to the median value in a single month.
The key risk for Perth going forward is affordability. A city that was once celebrated for its relative value is now approaching the pricing levels of eastern seaboard markets, which may naturally moderate the pace of growth.
Brisbane: The Olympic City Delivers 80.6% Growth
Brisbane has been one of the most consistent performers in Australia's property market, with dwelling values rising 80.6% over the past five years. The city's median dwelling value has pushed above the $1 million mark and sits at approximately $1,080,538 as of early 2026.
The growth story here is multi-layered:
Population-driven demand. Queensland has attracted significant interstate migration from NSW and Victoria, drawn by comparatively affordable housing, a relaxed lifestyle, and strong employment across construction, healthcare, and education sectors.
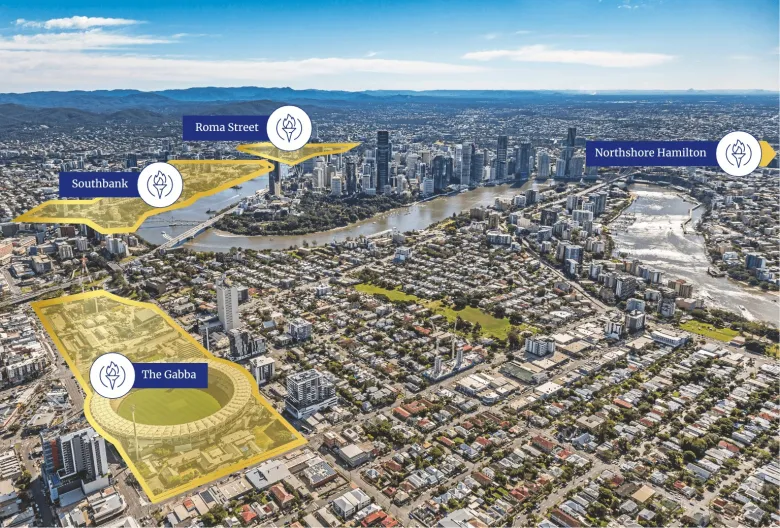
Olympic legacy effect. The upcoming 2032 Brisbane Olympic Games has catalysed major infrastructure investment across South East Queensland, reinforcing long-term confidence in the region's property values.
Rental market pressure. Advertised rental listings in Brisbane have been tracking approximately 29% below their five-year average, keeping vacancy rates extremely tight and pushing renters toward purchasing further supporting buyer demand.
Unit market strength. Brisbane's unit market has been particularly resilient, with unit values rising faster than houses in some periods as buyers adjust to affordability constraints and accept smaller dwellings at accessible price points.
A note on data nuance: some sources, including yourmortgage.com.au (citing Cotality), show Brisbane's five-year growth as high as 86.1% depending on the precise measurement window. The 80.6% figure referenced in the infographic represents the Cotality trough-to-peak measure widely cited in property research. Either way, the result is extraordinary.
Adelaide: South Australia's Quiet Achiever at 75.3%
Adelaide has been one of the most impressive and underreported property stories of the past five years. Cotality data officially confirms a five-year trough-to-peak growth of 75.3% for Adelaide dwelling values a figure that would have seemed unimaginable before the pandemic.
The drivers of Adelaide's growth are distinct:
Relative affordability as a magnet. For much of the past five years, Adelaide offered a significant affordability discount compared to Sydney, Melbourne, and even Brisbane. This drew interstate buyers and investors seeking value and in doing so, eroded that very affordability advantage.
Population growth and defence investment. South Australia's growing defence industry, particularly submarine construction and associated supply chains, has brought skilled, well-paid workers to the Adelaide market and underpinned employment confidence.
Interest rate resilience. Adelaide's dwelling values showed remarkable resistance during the RBA's tightening cycle of 2022-2023, largely because entry-level prices were still achievable for a wider pool of buyers.
As of 2026, Adelaide's median dwelling value sits at approximately $902,249. Growth has moderated slightly from its peak pace, but values remain near record highs. The city's auction clearance rates remain healthy, indicating continued depth of buyer demand.
Darwin: A Strong 33.1% Recovery from a Low Base
Darwin's 33.1% five-year growth is significant when viewed in context. The Northern Territory capital had been in a prolonged slump following the end of the LNG construction boom and corresponding population decline. The past five years represent a genuine recovery phase, driven by several tailwinds:
Post-pandemic lifestyle appeal. Darwin's low-density living, outdoor lifestyle, and relative affordability appealed to buyers during the pandemic period when remote work became viable.
Defence spending. Northern Australia's strategic importance has led to substantial Commonwealth investment in Darwin's military infrastructure, supporting local employment and housing demand.
Investor interest. Darwin offers some of the highest gross rental yields of any Australian capital city approximately 6% as of mid-2026 attracting investors who have been priced out of southern markets. At one point in 2025, investors represented nearly 49% of mortgage demand in the Darwin market.
Darwin remains the most affordable capital city in Australia for house purchases, with a median house price of approximately $709,975. This affordability, combined with high yields, continues to attract buyer interest from interstate.
Sydney: 17% Over Five Years Underperformance or Reset?
Sydney's 17% five-year growth is, by any reasonable analysis, a disappointing result for a city that commands Australia's highest median dwelling values. At approximately $1,280,613, Sydney remains the nation's most expensive property market but that very fact is central to its underperformance.
Affordability ceiling. Sydney's price-to-income ratio has long been among the highest in the world. As values rose, fewer buyers could meet bank serviceability requirements, effectively capping demand.
Rate sensitivity. Sydney's market is more sensitive to interest rate movements than other capitals because the large loan sizes involved mean that each rate change has a proportionally greater impact on borrowing capacity.
Supply dynamics. Unlike Perth or Brisbane, Sydney has had more stock available at various points, giving buyers more options and reducing the urgency that drives rapid price growth.
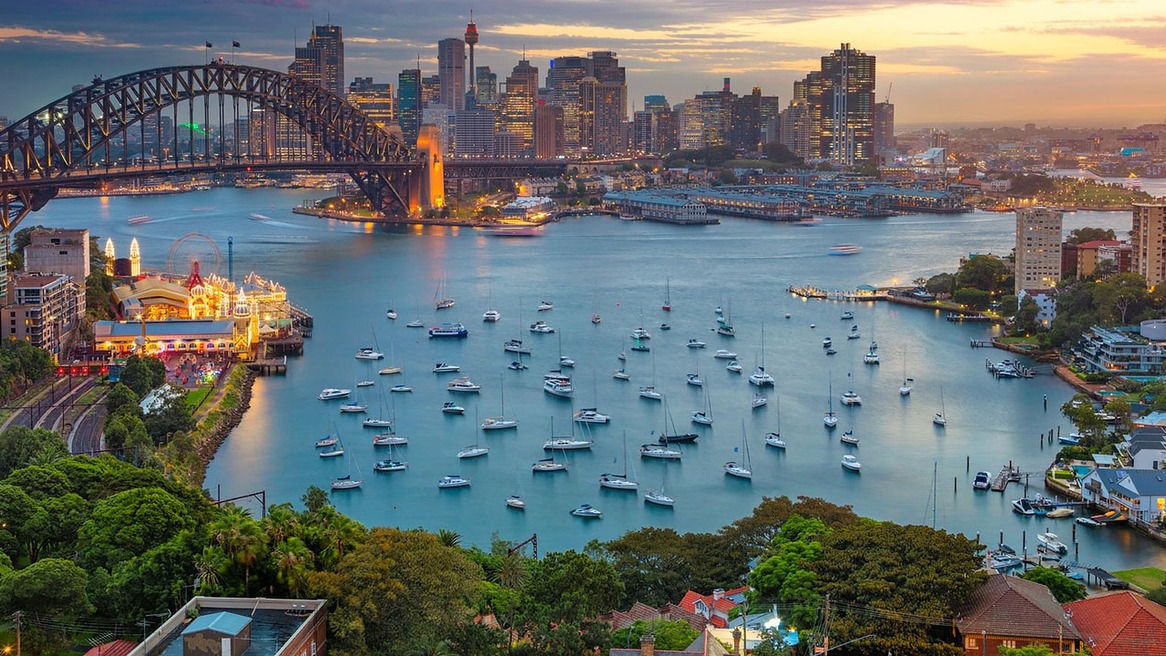
It would be a mistake, however, to write Sydney off. The city's structural undersupply a vacancy rate of around 1.7% and population growth of over 100,000 residents annually means the long-term case for Sydney property remains intact. Some data sources, including yourmortgage.com.au, report Sydney's five-year dwelling value change closer to 31% when measured using a different base period. The 17% figure reflects the specific five-year window shown in the infographic, which captures a period that includes the 2022 correction and the subsequent partial recovery.
Canberra: 15.6% A Tale of Two Phases
Canberra's 15.6% five-year result reflects a market that ran hard and then pulled back. The ACT capital surged strongly through the pandemic years, driven by public service employment stability and influx of buyers from Sydney seeking more affordable options. Canberra reached its peak in May 2022 and has not returned to those levels since, currently sitting approximately 2.1% below that high.
The city's property market is unusually dependent on government employment sentiment. As federal public service budgets fluctuate and remote work policies reduce the advantage of Canberra-based roles, demand has softened.
Nevertheless, Canberra's median dwelling value of approximately $903,374 places it among Australia's more expensive capital cities, and first home buyer activity has been notably high the ACT consistently records one of the highest proportions of first home buyer lending nationally, sitting at around 37%.
Melbourne: 3.3% The Nation's Weakest Major Market
Melbourne's 3.3% five-year growth is the most discussed anomaly in Australian property circles. For a city of nearly 5.5 million people Australia's most populous it represents a profound underperformance relative to peers.
Several factors explain Melbourne's stagnation:
State taxes and investor exodus. Victoria's state government has introduced a series of property-related taxes, including increased land taxes, levies on vacant properties, and changes to tenancy laws that have reduced the appeal of investment property in Victoria.
Supply overhang. Melbourne completed more new dwellings than any other capital city over the past decade, increasing supply and reducing upward price pressure.
Population dynamics. While Melbourne remains a major migration destination, it also experienced significant interstate population outflows during and after the pandemic, particularly to Queensland and Western Australia.
Economic headwinds. Victoria's economic recovery from pandemic disruptions, including extended lockdowns, has been slower than some other states.
The Macro Forces Behind Australia's Two-Speed Property Market
The five-year growth figures reveal a structural shift in Australian housing. For decades, Sydney and Melbourne dominated property investment discussion. That era appears to be transitioning, with mid-sized capitals proving they can generate superior growth at least over certain time horizons.
Several macroeconomic themes underpin the current landscape:
Interest rate cycle. The RBA's aggressive rate-hiking cycle from May 2022 to late 2023 hit rate-sensitive, high-value markets (Sydney and Melbourne) hardest. The subsequent rate cuts in 2025 reinflated growth nationally, but the re-tightening that began in early 2026 three rate rises bringing the cash rate back to 4.35% has again cooled southern markets first.
Population growth and migration. Australia's net overseas migration exceeded 500,000 in recent years, creating enormous pressure on housing supply in cities without the buffer of large land release pipelines.
Construction sector constraints. Across all capitals, new dwelling completions remain well below decade averages, reflecting labour shortages, construction cost inflation, and project delays. This chronic supply shortfall is the most significant upward structural pressure on Australian housing values.
The affordability migration. As Sydney and Melbourne became less accessible, buyers and renters migrated to more affordable capitals, directly driving demand in Perth, Brisbane, and Adelaide.
The investor shift. Nationally, credit growth for housing investment reached its fastest pace since December 2014 through 2025. Investors, attracted by improving rental yields and capital growth prospects outside the southern capitals, have directed capital toward WA, QLD, and SA reinforcing price growth in those markets.
Download Free Guide and Check Your Eligibility for $35,000 + 2% deposit for your 1ˢᵗ home!
What This Means for Buyers in 2026 and Beyond
For Perth: The exceptional growth of the past five years is unlikely to be repeated at the same pace. Affordability is tightening, and Perth's own price-to-income ratio is climbing. However, supply remains critically constrained and the commodities cycle continues to support local employment. Perth is now a growth story entering maturity rather than infancy.
For Brisbane: The Olympic decade (2025-2032) provides a structural demand narrative that few Australian cities can match. Infrastructure investment, strong interstate migration, and relatively affordable unit options all support continued, if more moderate, growth.
For Adelaide: The affordability advantage that drove Adelaide's surge is diminishing. Values near record highs and rising interest rates may temper gains. But South Australia's defence industry investment provides a long-term employment backbone that differentiates Adelaide from more cyclically exposed markets.
For Sydney and Melbourne: These cities face a challenging 12-24 months as rate rises and government policy changes weigh on investor sentiment. However, both cities' structural undersupply and population growth fundamentals mean that buyers with a long investment horizon (7-10 years) are likely to be rewarded. The question is whether the near-term softness creates genuine buying opportunities.
For Darwin and Hobart: High yields and relative affordability make Darwin appealing for income-focused investors. Hobart requires patience and a belief in its long-term lifestyle appeal, but its thin economic base means it will remain more volatile than mainland capitals.
Key Takeaways
Five years of Australian capital city house price data tells a story of profound divergence. The cities that delivered for buyers and investors were those with strong population inflows, chronically limited housing supply, resilient local economies, and critically a starting price point that still offered relative value.
Perth's near-doubling of values over five years is a once-in-a-generation result, built on a confluence of resource wealth, supply constraints, and interstate migration that may not repeat at the same magnitude. Brisbane and Adelaide have proved that mid-sized capitals can deliver genuine wealth creation over the medium term.
The lesson for buyers entering the market in 2026 is not simply to chase the city with the best recent number. That city's best growth may already be behind it. Instead, understanding the underlying supply and demand fundamentals population growth, housing stock levels, employment diversity, and infrastructure investment offers a more reliable framework for identifying the next decade's outperformers.
Frequently Asked Questions
Which Australian city had the highest house price growth over 5 years?
Perth recorded the highest five-year house price growth of any Australian capital city at 91.4%, according to Cotality's Home Value Index data.
Why has Melbourne underperformed other Australian capitals?
Melbourne's 3.3% five-year growth reflects a combination of increased property-related taxes, a higher completion rate of new dwellings relative to demand, and significant population outflows to other states during and after the pandemic period.
Is it too late to invest in Perth property?
Perth's growth has been extraordinary, but affordability is tightening. The long-term case for Perth underpinned by the commodities cycle and supply constraints remains credible, but buyers should expect more moderate growth ahead rather than a repeat of the past five years.
What is driving Brisbane's property market growth?
Brisbane's growth is driven by interstate migration, strong rental demand (vacancy rates remain very low), infrastructure spending tied to the 2032 Olympic Games, and a relative affordability advantage compared to Sydney.
What does Cotality's Home Value Index measure?
Cotality (formerly CoreLogic) is Australia's leading property data company. Its Home Value Index uses a hedonic methodology that accounts for the characteristics of properties transacting, providing a more accurate measure of price change than simple median price comparisons.
Data in this article is sourced from Cotality's Home Value Index, propertyupdate.com.au, yourmortgage.com.au, globalpropertyguide.com, and the Australian Bureau of Statistics. All figures are accurate as of mid-2026 and are subject to change as market conditions evolve. This article is for informational purposes only and does not constitute financial or investment advice.